A comprehensive data analytics project using SAS to manage over half a billion smart water meter readings, enabling early leak detection, customer awareness, and improved municipal water efficiency.
To analyze massive real-time water meter readings for the Town of Cary using SAS analytics, enabling efficient data management, leak detection, and data-driven decision-making for conservation efforts.
Integrated SAS for cleansing, visualization, and statistical modeling of over 500M readings from 60K wireless meters. Applied time-series and anomaly detection to identify usage spikes and missing values, with dashboards built in Power BI.
The SAS analytics system detected a major consumption spike on July 1, 2022, saving the municipality millions in potential water loss by automating leak alerts and optimizing billing accuracy.
Insight: Interactive SAS dashboard combining meter readings, water usage patterns, and leak detection summaries. Enabled decision-makers to view consumption trends in near-real time.
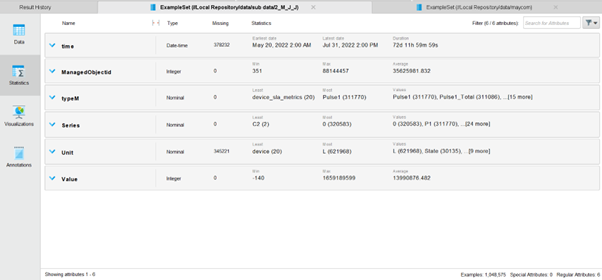
Insight: The dataset included six core attributes – TypeM, Time, Value, Unit, Series, and ManagedObjectID. Visualization highlighted distribution patterns and missing data intervals before cleansing.
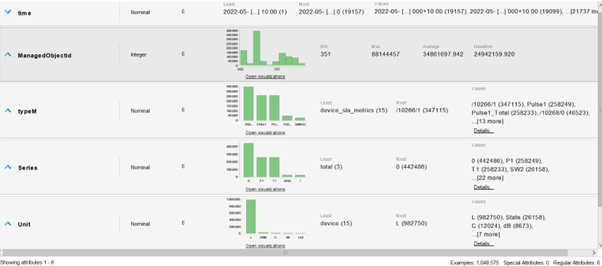
Insight: Post-cleaning, the dataset achieved 0% missing values in "Time" and "Unit" attributes. This drastically improved the accuracy and stability of analytical models and dashboards.
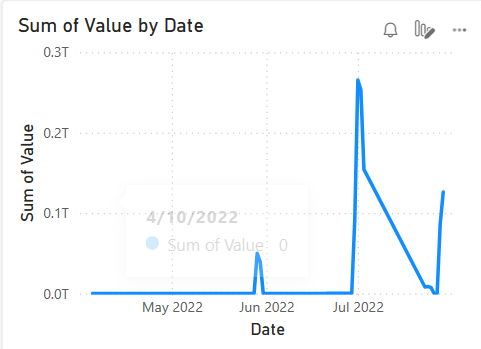
Insight: Analysis revealed a sharp anomaly on July 1, 2022, where total consumption surged beyond expected norms, signaling a likely leak event.
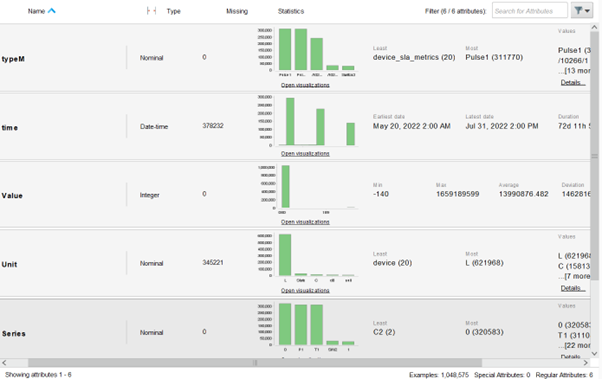
Insight: Data summary showed an average value of 13,990,876 liters across readings, with a minimum of -140 and a maximum exceeding 1.6 billion, confirming presence of outliers.
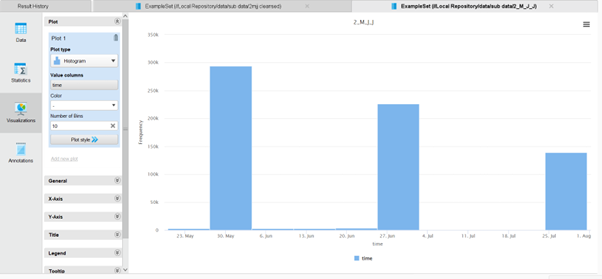
Insight: Time-series plots displayed improved continuity after imputation, reducing left-skewness and providing smoother hourly data curves across the 72-day period.
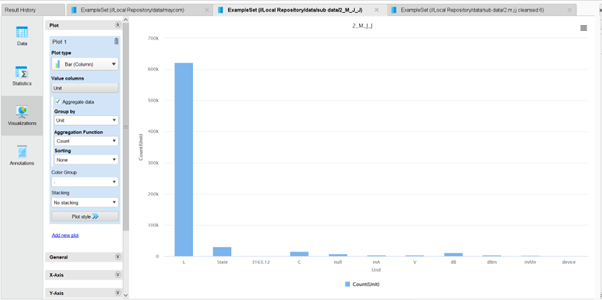
Insight: "L" (liters) dominated the dataset (621,968 entries), confirming it as the primary measurement unit, while "C" and "dB" represented sensor diagnostics.
SAS analytics tools were used to detect and replace missing or duplicate values. The unit column was imputed using mode replacement ("L"), while time values were filled using statistical interpolation for continuity.
Dashboards built in SAS and Power BI enabled dynamic visualization of consumption trends, leak alerts, and meter performance metrics across all zones in the Town of Cary.
Data stored on cloud platforms (AWS/Oracle) for scalability and accessibility. Integration with municipal systems facilitated real-time alerts and customer portal updates.
Saved over $10 million through early leak detection and automated meter readings.
Residents can monitor usage and receive alerts, promoting conservation and awareness.
Supports eco-friendly initiatives through reduced waste and optimized water distribution.