Visual Analysis & Insights
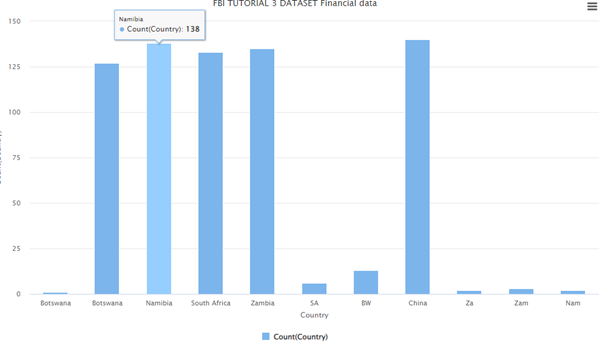
Geographic Distribution Analysis
Insight: Namibia leads with 237,442 units sold (21.09% of total), significantly outperforming other markets. However, China shows second-highest COGS at $22M despite fewer units sold, indicating higher operational costs. This geographical analysis revealed a 235,551 unit spread between top (Namibia) and bottom (ZA) performers, highlighting major market disparities that require targeted strategies.
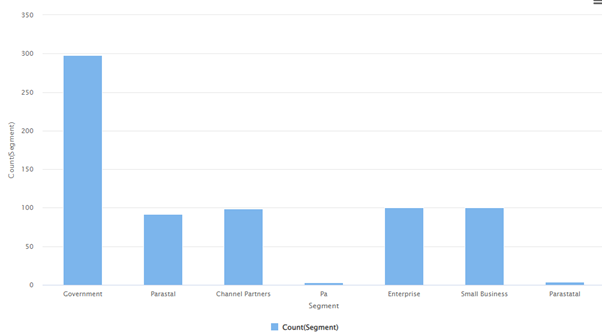
Customer Segment Performance
Insight: Government sector generates $52.4M in sales with $56M in gross sales, representing 44.2% market dominance. Parastatals show the lowest performance at $180,236, creating a $52.3M spread. This concentration suggests dependency on government contracts and highlights diversification opportunities in underserved segments like small business and enterprise markets.
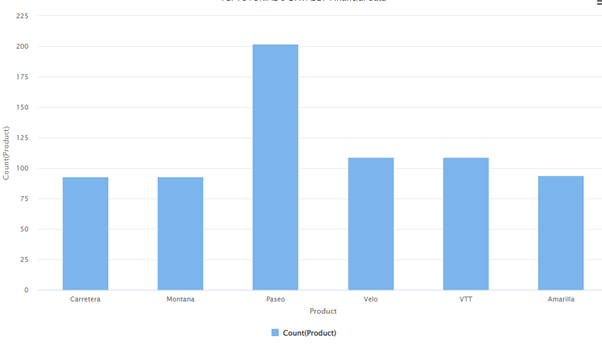
Product Portfolio Analysis
Insight: Paseo dominates with 28.9% market share (202 transactions) and highest sales, but also shows highest COGS at $28.2M, potentially impacting profit margins. Montana, despite lowest frequency (13.3%, 93 transactions), maintains moderate COGS at $13.3M. Amarilla commands premium manufacturing price ($260) while Carretera has lowest at $3, suggesting diverse product positioning strategies across the portfolio.
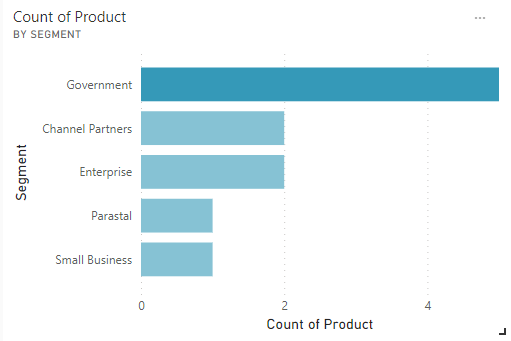
Product Distribution Analysis
Insight: Distribution chart reveals Paseo's market dominance with the highest frequency count, followed by a more balanced distribution among other products. This visualization helps identify which products are driving volume and which may need additional marketing support or strategic repositioning to capture greater market share.
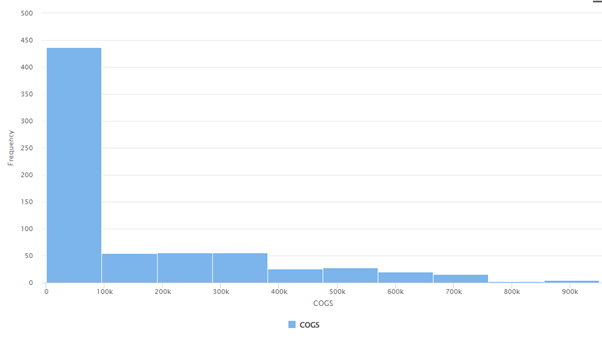
Cost of Goods Sold Analysis
Insight: COGS distribution shows significant variation across the portfolio with a maximum of $950,625 and average of $145,479. The data reveals operational cost patterns that directly impact profitability. Understanding these cost structures enables better pricing strategies and identifies opportunities for cost optimization across product lines.
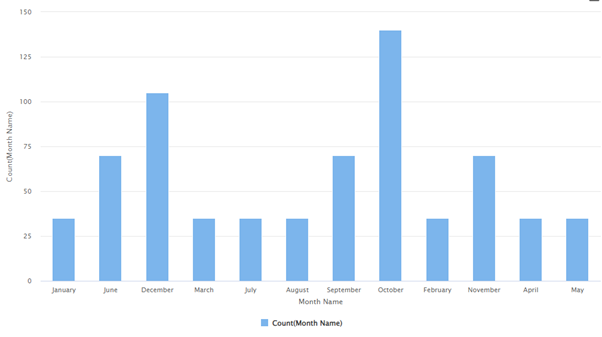
Temporal Sales Patterns
Insight: Analysis of monthly distribution reveals strong seasonality with peaks in months 11-12 (end of year), reaching maximum frequency of 175 transactions in December. Additional spikes observed in months 5.5-6.5 (mid-year) and months 1-2 (beginning of year), suggesting quarterly purchasing cycles. This pattern enables optimized inventory management and targeted marketing campaigns during high-activity periods.
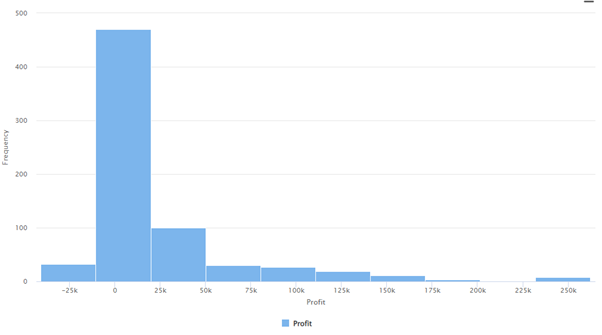
Profitability Distribution
Insight: Profit analysis reveals a range from -$40,618 (losses) to $262,200 (maximum profit) with an average of $24,138. The distribution shows most profitable transactions cluster in the $10,335-$19,946 range. This insight is critical for identifying high-margin opportunities and addressing loss-making transactions to improve overall portfolio profitability.
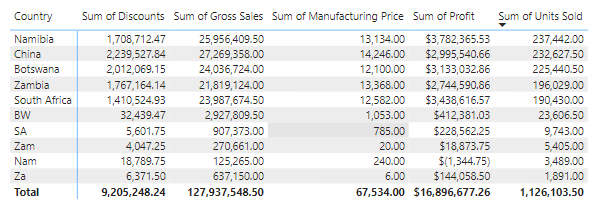
Country Performance Review
Insight: Comprehensive country-level review comparing units sold, manufacturing costs, COGS, and profitability across all 10 markets. China leads in frequency (20% of dataset) while Botswana shows the lowest presence. This multi-dimensional view enables targeted country-specific strategies for market penetration and resource allocation optimization.