Back to Projects

LA Crime Data Analysis & Predictive Modeling

Comprehensive analysis of crime patterns in Los Angeles using machine learning and statistical methods to identify hotspots, predict trends, and provide actionable insights for law enforcement resource allocation across 900,000+ crime incidents from 2020 to present.

2020 - Present
966,940+ Records
LA County Analysis
Predictive Models
Python scikit-learn Excel Tableau Kaggle Dataset

Key Statistics

966,940

Crime Records Analyzed

30%

Vehicle Theft (Top Crime)

66.3%

Crimes Without Weapons

12 AM

Peak Crime Time

Project Overview

Objective

To analyze comprehensive crime data from Los Angeles to identify patterns, hotspots, and trends that enable the Chief of Police to make data-driven decisions for resource allocation, crime prevention strategies, and public safety improvements. Developed predictive models to forecast crime occurrence based on location, time, and historical patterns.

Methodology

Utilized Kaggle's LA Crime Dataset (2020-present) with comprehensive data cleaning to handle missing values (60%+ in weapon fields), standardize formatting, and remove outliers. Applied descriptive statistics, geospatial analysis for hotspot identification, temporal analysis for pattern detection, and machine learning techniques for predictive modeling and trend forecasting.

Critical Discovery

Central District identified as the primary crime hotspot accounting for 6.8% of all incidents, with vehicle theft representing 30% of total crimes. Analysis revealed that 12 AM is the peak crime hour with 30,000+ incidents, while 7 PM shows the lowest occurrence. The average victim age of 29.36 years suggests targeted outreach programs for young adults could significantly impact crime prevention efforts.

Data Quality & Preparation

Challenge: Inconsistent Formatting

Issue: Date fields (Date Rptd, DATE OCC) contained inconsistent formatting with some entries missing AM/PM indicators and others in text format preventing proper analysis.

Solution: Applied text-to-column function with delimiter options, then standardized using custom format (dd/mm/yyyy hh:mm:ss AM/PM) for uniformity across all date-time entries.

Challenge: Outliers & Anomalies

Issue: Vict Age field contained negative values and invalid entries from manual data collection errors, skewing statistical analysis.

Solution: Used descriptive statistics to calculate mean (29.36) and median (30), replacing negative values with these measures. Maintained 0 values recognizing crime affects all age groups.

Challenge: Missing Values

Issue: Over 60% missing data in Weapon Desc, Vict Sex, Weapon Used Cd, and Cross Street fields - too significant for standard imputation.

Solution: Replaced with "N/A" to preserve data integrity, recognizing that many crimes occur without weapons, making this missing data actually valuable information.

Visual Analysis & Key Insights

LA Crime Dashboard
Interactive Crime Analytics Dashboard

Insight: Comprehensive dashboard providing real-time overview of LA crime landscape with dynamic filtering capabilities. Enables stakeholders to explore data across multiple dimensions including crime type, location, time, victim demographics, and weapon usage. The dashboard features drill-down functionality for detailed analysis and supports data-driven decision making through intuitive visualizations and user-friendly slicers for customized views.

Crime Hotspots
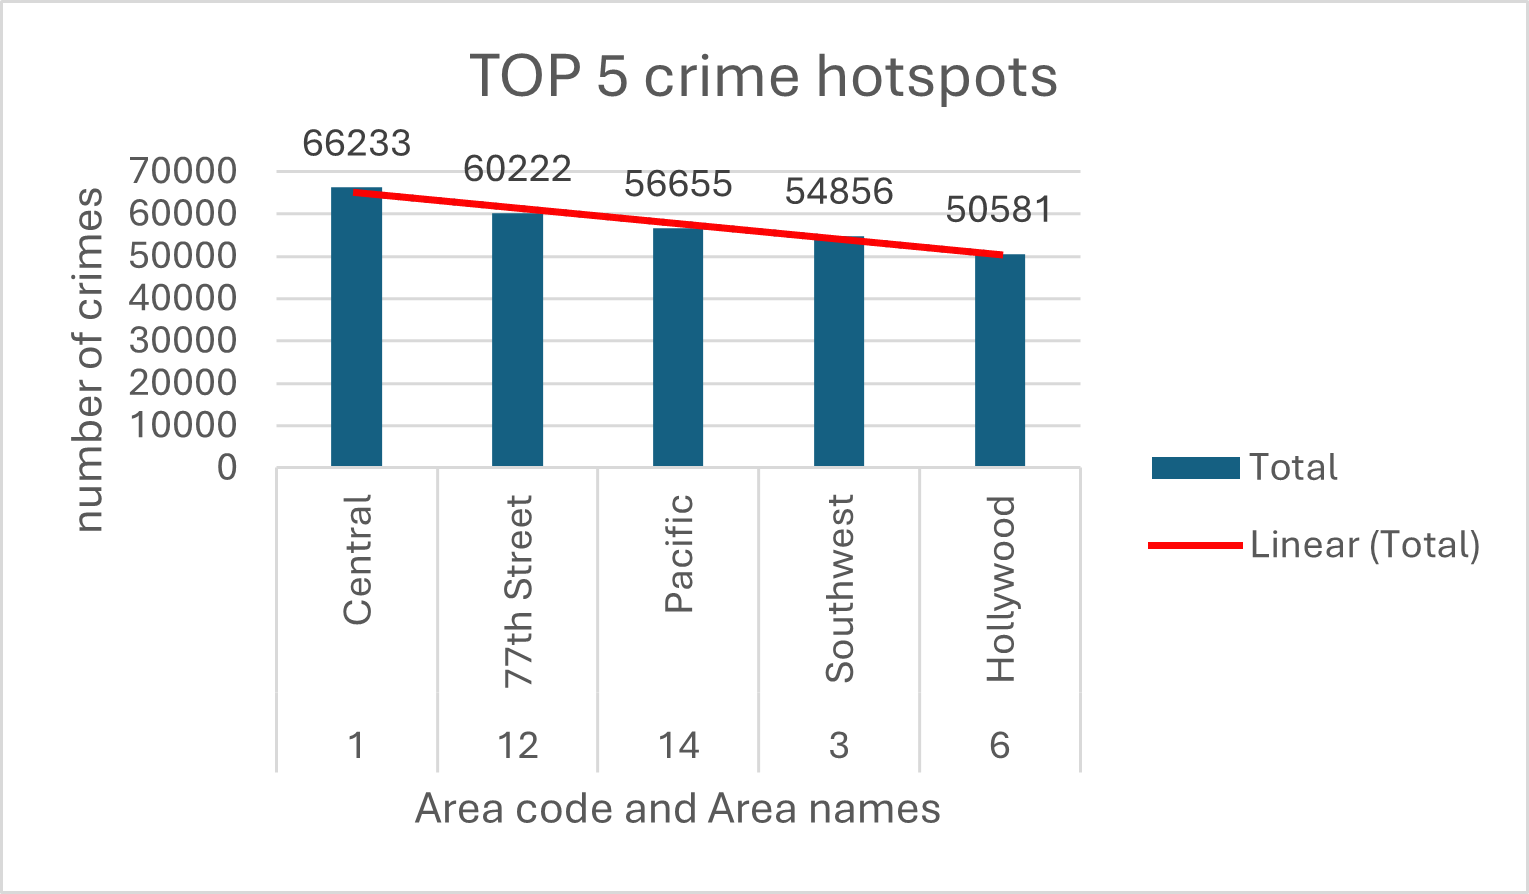
Top 5 Crime Hotspots in Los Angeles

Insight: Geographic analysis identifies Central District (Area Code 1) as the primary hotspot accounting for 6.8% of all crime incidents, closely followed by 77th Street. These top 5 areas represent concentration zones requiring priority resource allocation. Heat map visualization enables strategic deployment of law enforcement, targeted community policing initiatives, and focused crime prevention programs. Understanding spatial distribution allows for efficient patrol scheduling and rapid response optimization in high-risk areas.

Crime Types Distribution
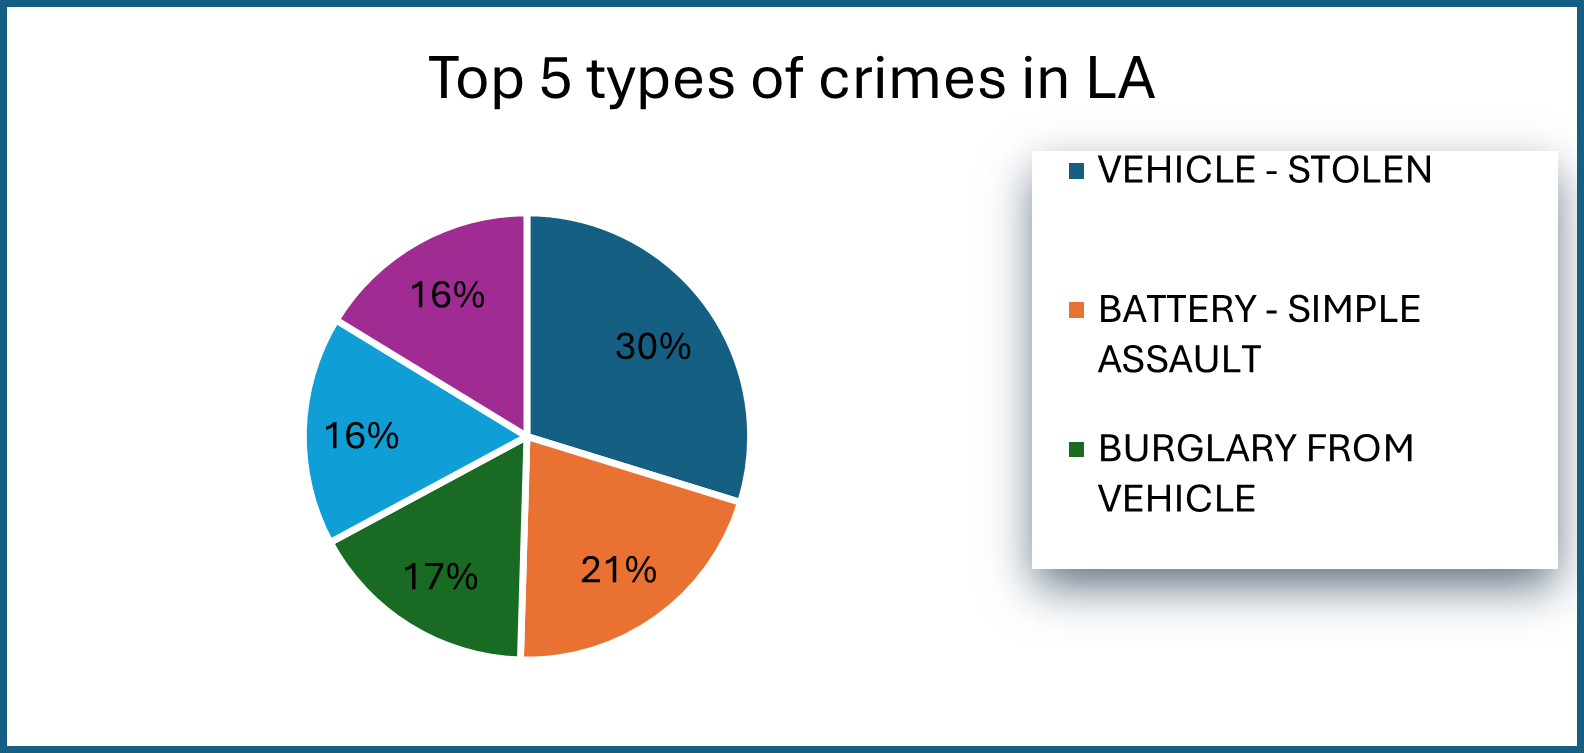
Top 5 Crime Types Analysis

Insight: Vehicle theft dominates LA crime landscape at 30% of total incidents, representing the single largest crime category. Battery and burglary from vehicles follow as significant concerns. This distribution reveals specific crime prevention opportunities - enhanced vehicle security measures, parking lot surveillance, and targeted anti-theft campaigns could substantially reduce overall crime rates. Understanding crime type prevalence enables department to develop specialized units and tailored intervention strategies for maximum impact.

Weapons Used
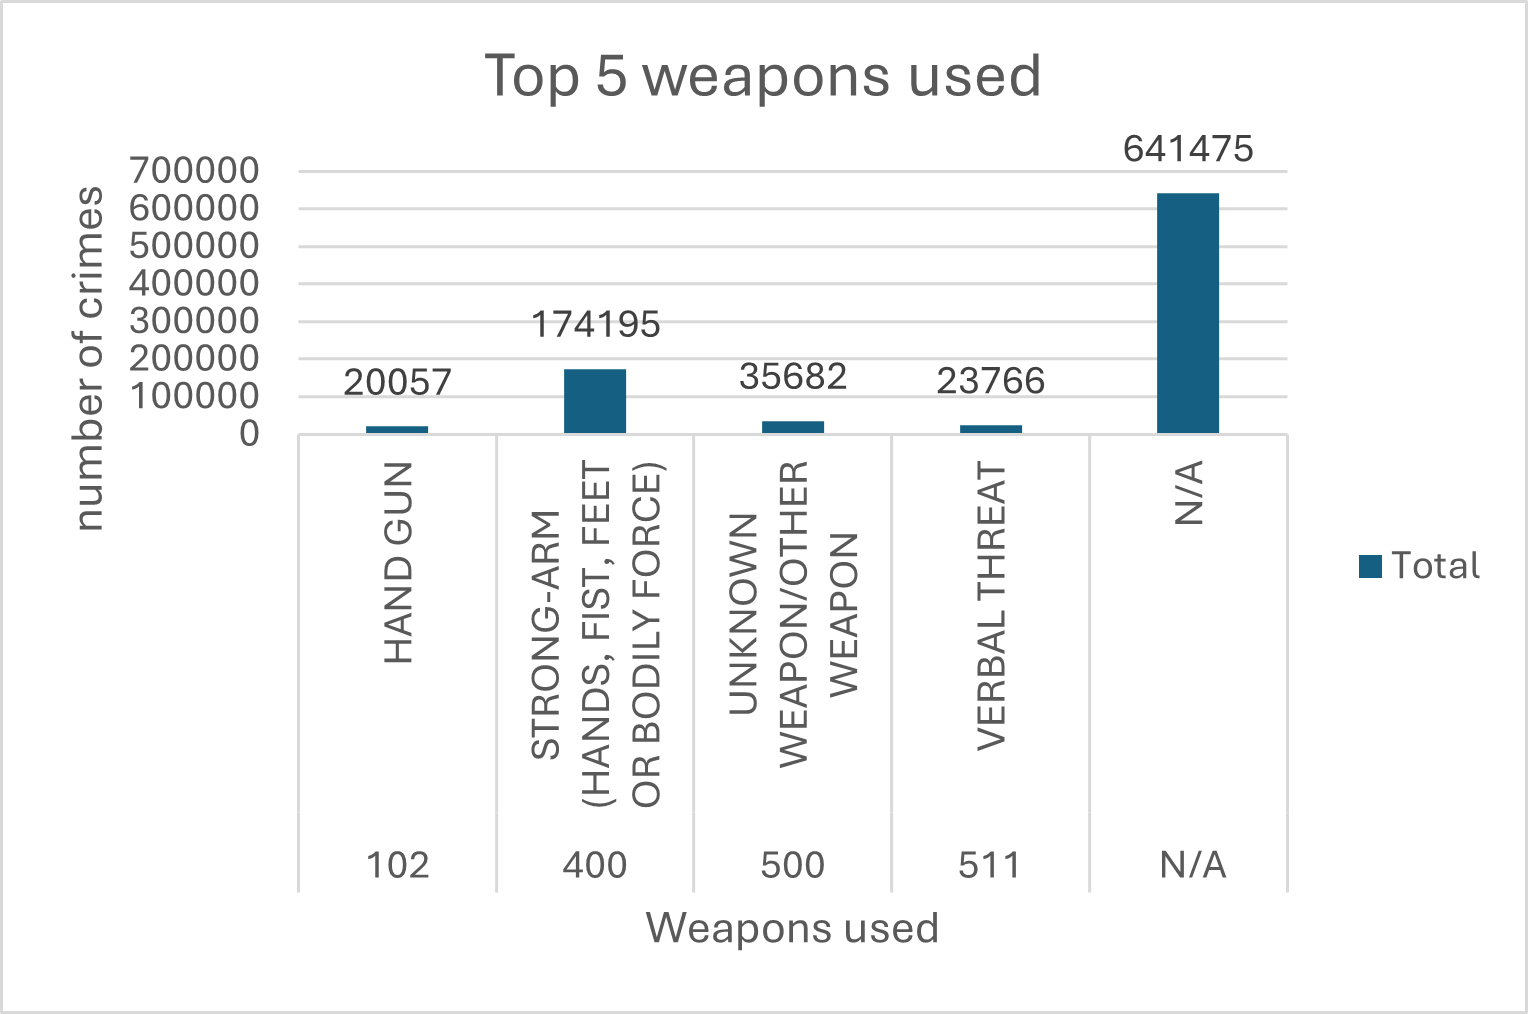
Weapon Usage in Crime Incidents

Insight: Remarkably, 66.3% (641,475 incidents) of crimes involved no weapons, suggesting many incidents are property crimes, verbal altercations, or non-violent offenses. This finding is crucial for resource allocation - indicates need for balanced approach between armed response units and community policing. When weapons are used, tracking specific types enables targeted gun control initiatives and weapon amnesty programs to reduce illegal weapon circulation and violent crime.

Crime Time Analysis
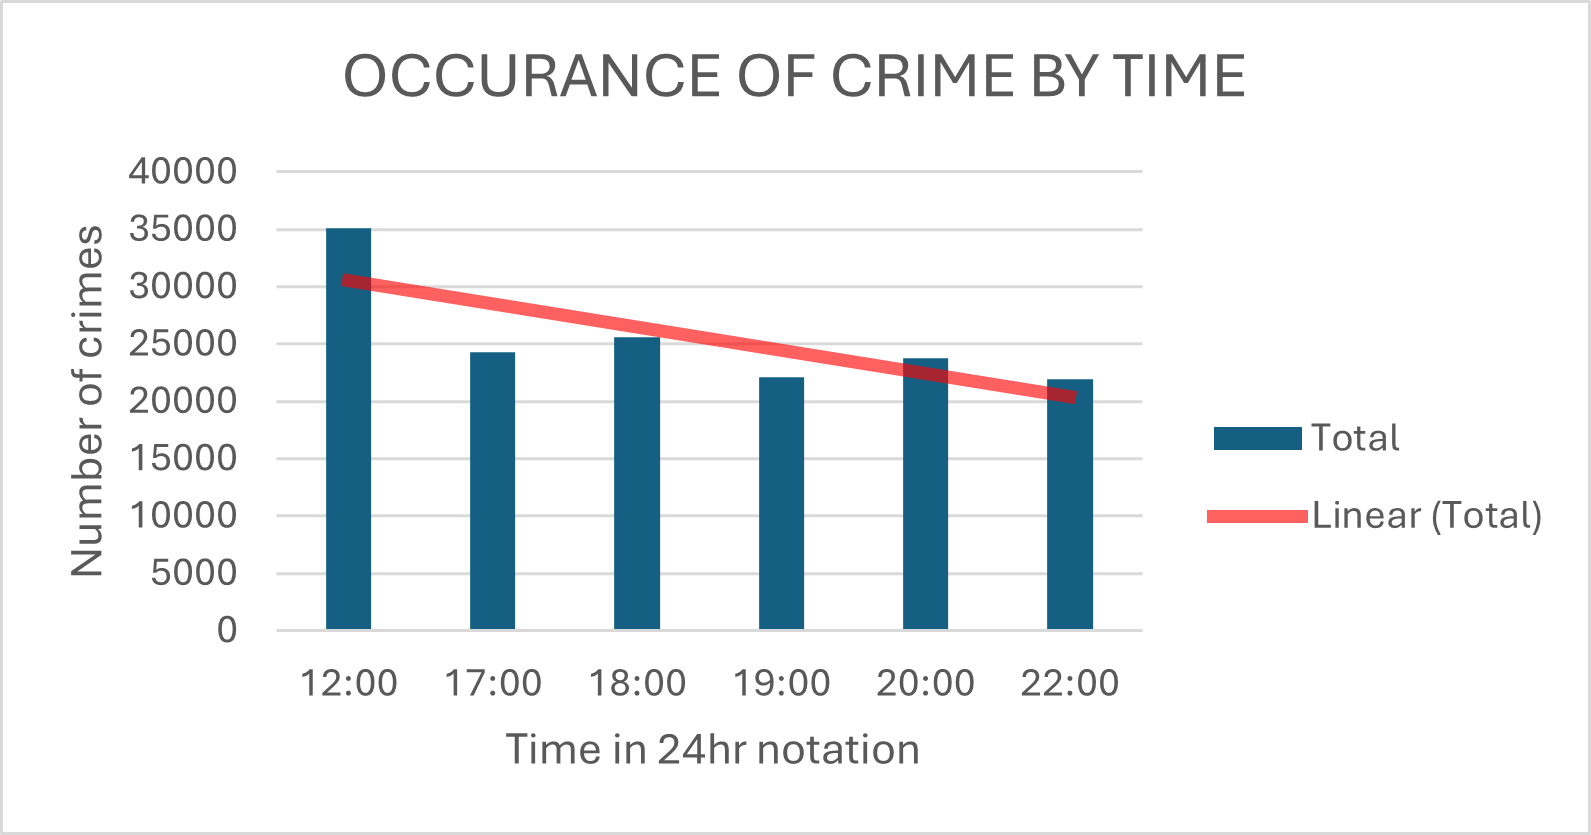
Temporal Crime Patterns (24-Hour Analysis)

Insight: Crime occurrence peaks dramatically at 12:00 AM (midnight) with 30,000+ incidents, while 19:00 (7 PM) shows the lowest activity. Late-night hours (midnight to 3 AM) represent critical period requiring maximum law enforcement presence. This temporal pattern enables optimized patrol scheduling, strategic officer deployment during high-risk hours, and efficient resource allocation. Understanding time-based trends supports predictive policing models and allows department to be proactive rather than reactive in crime prevention.

Victim Age Statistics
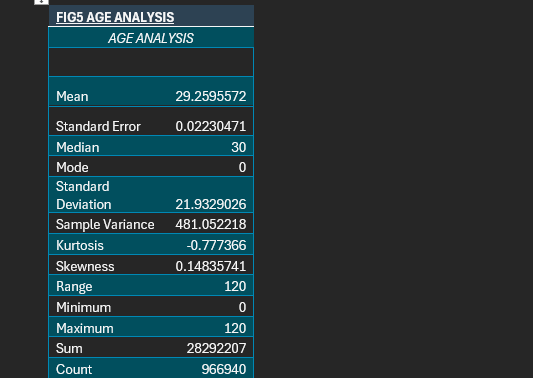
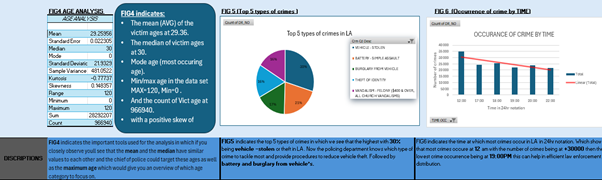
Victim Age Demographics & Distribution

Insight: Statistical analysis reveals mean victim age of 29.36 years with median at 30, indicating young adults as primary crime victims. Age range spans 0-120 years (966,940 records) with slight positive skew (0.148) and negative kurtosis (-0.777) suggesting relatively symmetric but flatter distribution. This demographic insight enables targeted outreach programs, age-specific prevention campaigns, and community engagement initiatives focused on late-20s/early-30s population. Understanding victim demographics is crucial for developing effective public safety education and support services.

Crime KPIs
Key Performance Indicators

Insight: Dashboard KPIs provide at-a-glance metrics for executive decision-making, tracking total incidents, crime type distribution, geographic concentration, and temporal patterns. These indicators enable rapid assessment of crime trends, evaluation of intervention effectiveness, and data-driven policy adjustments. Real-time KPI monitoring supports agile response to emerging crime patterns and facilitates transparent reporting to stakeholders and the public.

Strategic Recommendations

1. Data-Driven Patrol & Hotspot Focus

Increase law enforcement presence in Central District and 77th Street (top hotspots) with enhanced patrols during midnight-3AM peak hours. Utilize predictive analysis to deploy resources preemptively in high-risk areas. Implement real-time crime mapping for dynamic resource allocation and rapid response optimization. This targeted approach maximizes officer effectiveness and community safety impact.

2. Vehicle Theft Prevention Campaign

Launch comprehensive anti-theft initiative addressing 30% of crimes. Implement parking lot surveillance, vehicle registration checkpoints, and on-ground policing in high-theft areas. Develop public awareness campaigns offering theft prevention tips, tracking technologies, and reporting protocols. Partner with insurance companies and auto dealers for community education and deterrent programs.

3. Gun Control & Weapon Monitoring

While 66% of crimes don't involve weapons, tracking weapon-related incidents is critical. Advocate for stricter gun control policies, mandatory reporting of lost/stolen firearms, and regular weapon amnesty programs. Focus enforcement on reducing illegal weapon circulation through targeted operations and community engagement. Monitor weapon trends to identify emerging threats.

4. Targeted Demographic Outreach

Develop specialized programs for 25-35 age group (mean victim age 29.36). Offer self-protection workshops, awareness campaigns about common crimes, and accessible social services. Create neighborhood watch programs and community policing initiatives. Address root causes through partnerships with social services, employment programs, and educational institutions to reduce crime vulnerability.

Technical Implementation & Skills Demonstrated

Data Processing & Machine Learning

Utilized Python with pandas for data manipulation, handling 966,940+ records with complex data quality issues. Implemented scikit-learn for predictive modeling, creating classification models to predict crime types and regression models for crime frequency forecasting. Applied feature engineering to extract temporal patterns (hour, day, month) and geographic clustering for hotspot identification. Validated models using cross-validation techniques and optimized for accuracy and interpretability.

Visualization & Dashboard Development

Created interactive dashboards in Excel and Tableau featuring dynamic filtering, drill-down capabilities, and intuitive user interfaces. Implemented heat maps for geographic visualization, time-series charts for temporal analysis, and distribution plots for demographic insights. Designed for both technical and non-technical stakeholders, ensuring accessibility and actionable insights for decision-makers at all levels of law enforcement hierarchy.

Data Quality & ETL Pipeline

Developed systematic data cleansing workflow addressing inconsistent formatting, missing values (60%+ in some fields), and outlier detection. Created standardized data dictionary and documentation. Implemented validation checks and quality metrics to track improvements. Built reusable ETL pipeline for automated data updates and continuous analysis as new crime data becomes available from Kaggle and LAPD sources.

Project Impact & Outcomes

Actionable Intelligence

Delivered 8+ data-driven recommendations for crime reduction and resource optimization

Hotspot Identification

Identified top 5 crime hotspots enabling strategic deployment of law enforcement

Predictive Capability

Built machine learning models forecasting crime patterns for proactive policing